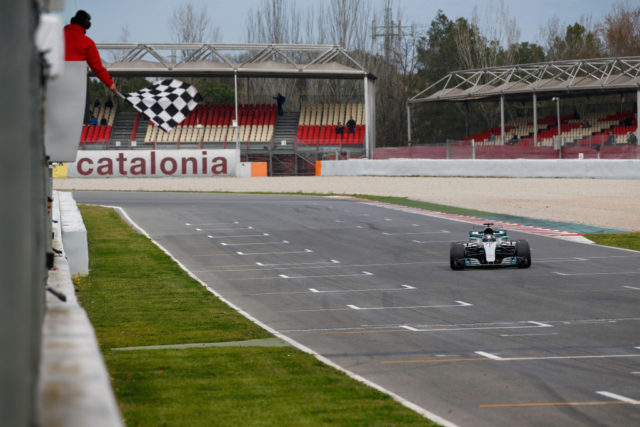
84.681 seconds… This was the reference taken midway through 2015 when it came to formulating a goal for the new generation of Formula One cars. They were to be visually more aggressive, harder to drive and significantly faster thanks to new rules that, for the first time in the sport’s history, aimed to increase the cars’ performance. In numerical terms, that translated to lap times five seconds a lap faster than the 2015 pole time of 1:24.681 at the Circuit de Barcelona-Catalunya. The Mercedes team analyses what happened and what is expected during the weekend in Spain.
Just under two years later, the F1 circus will arrive in Barcelona this weekend chasing that target. To meet the goal would need a lap of 1:19.681 in qualifying – a mark comfortably exceeded by Kimi Raikkonen during winter testing with a best lap of 1:18.635. However, this came in cooler winter weather, with softer tyre compounds available than those used on the race weekend – but with the testing caveat of unknown fuel loads. By way of comparison, the best time during testing in 2015 was 1:22.792 – nearly two seconds faster than the pole time later that year.
So what do the numbers so far lead us to expect this weekend when it comes to ultimate performance?
The table below shows the comparison of pole position times between 2015 and 2017 at the four races so far of the new season.
| 2015 Pole | 2017 Pole | Lap time Δ (s) | % Δ | |
| Australia | 1:26.327 | 1:22.188 | 4.139 | 4.8 |
| China | 1:35.782 | 1:31.678 | 4.104 | 4.3 |
| Bahrain | 1:32.571 | 1:28.769 | 3.802 | 4.1 |
| Russia | 1:37.113 | 1:33.194 | 3.919 | 4.0 |
| Spain Target | 1:24.681 | 1:19.681 | 5.000 | 5.9 |
On average, the cars have been 3.991s quicker over a qualifying lap – or, in percentage terms, 4.3% faster than their counterparts were in 2015. The largest delta relative to 2015 came in Melbourne, with a 4.8% performance increase; the smallest in Sochi, which was “ only” 4% faster than the corresponding pole time two years ago. However, this disparity can be explained, at least in part, by the shift in calendar timing of the race. In 2015, Sochi was Round 15 of the championship in mid-October; the 2017 race was held six months earlier in late April, meaning the cars are much earlier in their in-season development cycles.
In each instance, the pole position time in 2017 was the fastest ever lap seen at each circuit, reinforcing the claim that, even if still some way short of the five second per lap target, these are the fastest F1 cars in history.
| 2017 Pole | Previous Outright Lap Record | Lap time Δ (s) | % Δ | |
| Australia | 1:22.188 | 1:23.529 (VET, 3rd Quali, 2011) | 1.341 | 1.6 |
| China | 1:31.678 | 1:32.238 (MSC, Race, 2004) | 0.560 | 0.6 |
| Bahrain | 1:28.769 | 1:29.493 (HAM, Q3, 2016) | 0.724 | 0.8 |
| Russia | 1:33.194 | 1:35.337 (ROS, Q2, 2016) | 2.143 | 2.2 |
What’s more, analysis of the race fastest laps shows that the performance improvement has been translated into race conditions as well:
| 2015 Fastest Lap | 2017 Fastest Lap | Lap time Δ (s) | % Δ | Previous Race Lap Record | |
| Australia | 1:30.945 | 1:25.538 | 5.407 | 5.9 | 1:24.125 |
| China | 1:42.208 | 1:35.378 | 6.830 | 6.7 | 1:32.238 |
| Bahrain | 1:36.311 | 1:32.798 | 3.513 | 3.6 | 1:31.947 |
| Russia | 1:40.071 | 1:36.844 | 3.227 | 3.2 | 1:39.094 |
| Spain Target | 1:28.270 | – | – | – | 1:21.670 |
In many cases the fastest race laps are also now approaching all-time historic highs – notwithstanding many of the old benchmarks being set on new tyres and low fuel from back in the days of refuelling. Of course, any assessment of fastest laps is more vulnerable to anomalies than qualifying times – but the trend is nevertheless clear.
But with a target of a five-second-per-lap improvement relative to 2015 – and the historical tendency for teams to find more performance than expected under new rules – why are this year’s car not even faster than they actually are?
First, there was a prudent caution applied to how the rules were formulated. Targets were established two years before the rules came into force and, as the regulations evolved, some of the initial freedoms where whittled away, with the prevailing opinion that it was better to under-hit the five second improvement and allow the teams to grow into the new generation of rules, rather than overshoot and limit future development potential. The cautious expectation is that the cars will be another second a half faster by 2018…
Second, the improvement will naturally vary from circuit to circuit.
Overall, approximately 60% of the improvement relative to 2015 has come from the new aerodynamic regulations, 30% from the larger tyres and 10% from the power unit
At circuit with high aerodynamic sensitivity and a low power focus, such as Barcelona, gains will be greater than at circuits that are more power sensitive – and where long straights also penalise the higher drag levels of the 2017 cars. Lap time differences will also naturally be greater at longer, aero-sensitive circuits (such as Spa-Francorchamps or Suzuka) than at power-sensitive venues favouring low drag, such as Monza. The full picture will only become clear once the season is complete.
So while the numbers may suggest that the five second target has – for now – been missed, it’s perhaps most appropriate to concentrate on the soft factors that mark F1’s step into the unknown for 2017. Drivers are enthusing about the challenge of the new cars – and we are seeing larger differentials between team-mates from weekend to weekend in these tricky-to-master vehicles. F1 cars are indisputably the fastest cars on the planet, racing much closer to flat out from start to finish. And, rather than being a predictable DRS-enabled formality, overtaking has once again become a racing art form.
Most importantly, though, after four races, there are two teams locked together at the top of the Constructors’ Championship – and a developing struggle for the Drivers’ title, too.
It’s shaping up to be the most memorable F1 season in years. And the moment the cars pass that five-second marker will be a final confirmation that the new rules have delivered in that respect, too.


